Financial statements
All of the operating fund sources and associated spending are reflected in the university’s financial statements. The information provided is a highlight of VCU's financial statements. The full audited financial statements are available from the Controller's Office.
Breaking down VCU's financial statements
Total Assets and Deferred Outflows
Total Liabilities and Deferred Inflows
VCU Net Position
VCU Revenue
VCU Expenses
Breaking down VCU's financial statements
Terms frequently used when describing VCU's financial statements:
Cash and Investments refers to the university's liquid assets and financial investments.
- Cash is the amounts held in the University’s bank account to pay operating expenses
- Investments – Professional investment managers manage the University’s investments. The University's investments are governed by an Investment Policy, adopted by its Board of Visitors. The primary investment objective is to provide a framework for prudent investment management, while allowing for sufficient flexibility to capture investment opportunities as they may occur.
Current liabilities are short-term expenses expected to be paid within 1 year. On VCU’s financial statements these include the following:
- Amounts payable to vendors for outstanding invoices
- Unearned revenues from summer tuition, sponsored agreements, and advance funding for the operation of VCUQ
- Short-term liabilities – amounts due on our commercial paper borrowing
- Current portion of long-term liabilities described below – amount of these liabilities due in one year
Deferred inflows and outflows represent certain revenues and expenses that are recognized in a reporting period but are not yet realized or fully earned.
- Deferred inflows represent resources that the government has received or will receive but has not yet earned or recognized as revenue. The deferred outflows of resources have a positive effect on net position similar to assets.
- Deferred outflows represent costs or expenditures that have been incurred but will be recognized as expenses in future periods. The deferred inflows of resources have a negative effect on net position similar to liabilities.
Net position is the difference between the total of assets and deferred inflows of resources, and the total of liabilities and deferred outflows of resources. It is the financial snapshot of the University including all assets and liabilities.
Noncurrent liabilities are long-term expenses not expected to be paid within 1 year. These include:
- Funds held for others such as student organizations and federal loans
- Long-term liabilities
- Debt issued to finance construction of new facilities
- Amounts due to employees for accrued leave that is unpaid as of June 3o
- Lease obligations
- Subscription based technology arrangements
- Deferred compensation – liability for Faculty Early Retirement Incentive Plan (FERIP)
- Pension and post employment benefit liabilities
Receivables are amounts due to be received by the University. These include funds from:
- Student tuition and fees
- Sponsors for expenses incurred on sponsored projects
- Contributions and gifts – such as the Liver Institute Gift
- Affiliated foundations
- Commonwealth of VA – funding for capital projects and deferred maintenance as well as Higher Education Equipment Trust Fund (HEETF) reimbursement
Receivables and other assets increased primarily due to higher receivables from students, grant sponsors and the Commonwealth of Virginia for capital projects, which were partially offset by lower contributions receivable, reflecting the receipt of the Liver Institute cash.
The composition of deferred outflows and inflows of resources at June 30, 2025 for the University is summarized as follows:
| Other Post Employment Benefits | Pension Related | Gain/Loss Debt Refunding | Leases | Total | |
|---|---|---|---|---|---|
| Deferred outflows of resources: | $27M | $102M | $5M | $0 | $134M |
| Deferred inflows of resources: | $27M | $40M | $1M | $7M | $75M |
Deferred outflows of resources are defined as the consumption of net assets applicable to a future reporting period. The deferred outflows of resources have a positive effect on net position similar to assets. The majority of the deferred outflows for VCU are the result of pension and post-employment benefits. The measurement of the pension liability and the fiduciary’s net position is determined by the Virginia Retirement System (VRS).
| Categories | 2024 | 2025 |
|---|---|---|
| Capital Assets | $1.4B | $1.4B |
| Cash and Investments | $710M | $789M |
| Deferred Outflows | $119M | $134M |
| Receivables and Other Assets | $525M | $527M |
Total Liabilities and Deferred Inflows

Deferred inflows of resources are defined as the acquisition of net assets applicable to a future reporting period. The deferred inflows of resources have a negative effect on net position similar to liabilities. The measurement of the pension liability and the fiduciary’s net position is determined by the Virginia Retirement System (VRS).
| Categories | 2024 | 2025 |
|---|---|---|
| Current Liabilities | $260M | $306M |
| Non-current Liabilities | $916M | $858M |
| Deferred Inflows | $75M | $75M |
VCU Net Position
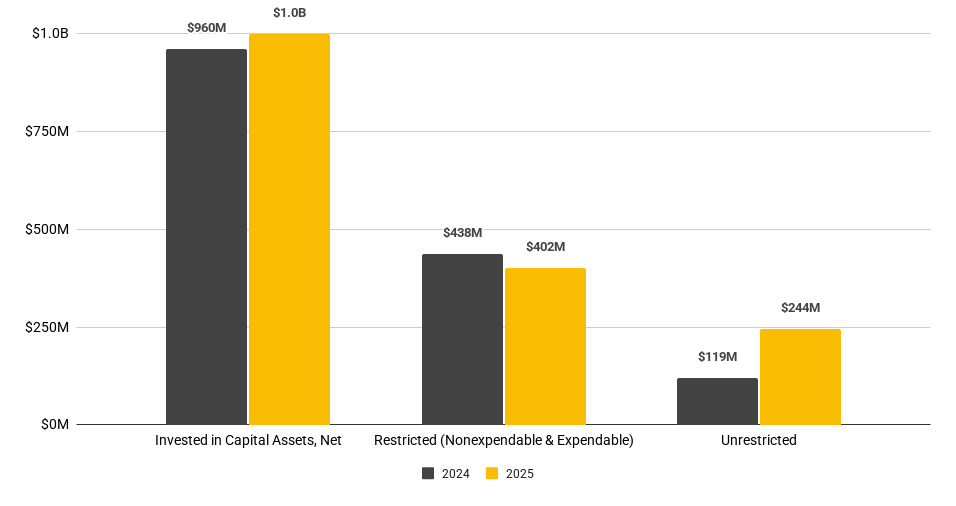
Restricted net position is divided into two categories: nonexpendable and expendable. The corpus of nonexpendable restricted net position is only available for investment purposes. Expendable restricted net position is available for expenditure by the University but must be spent for purposes as determined by donors and/or external entities that have placed time or purpose restrictions on the use of the assets.
VCU first reported a negative unrestricted net position in FY18 as a result of implementing GASB 75, which required us to report pension and post-employment liabilities on our financial statements that had previously only been reported at the State level.
| Categories | 2024 | 2025 |
|---|---|---|
| Invested in Capital Assets, Net | $960M | $1.0B |
| Restricted - Nonexpendable & Expendable | $438M | $402 |
| Unrestricted | $119M | $244M |
VCU Revenue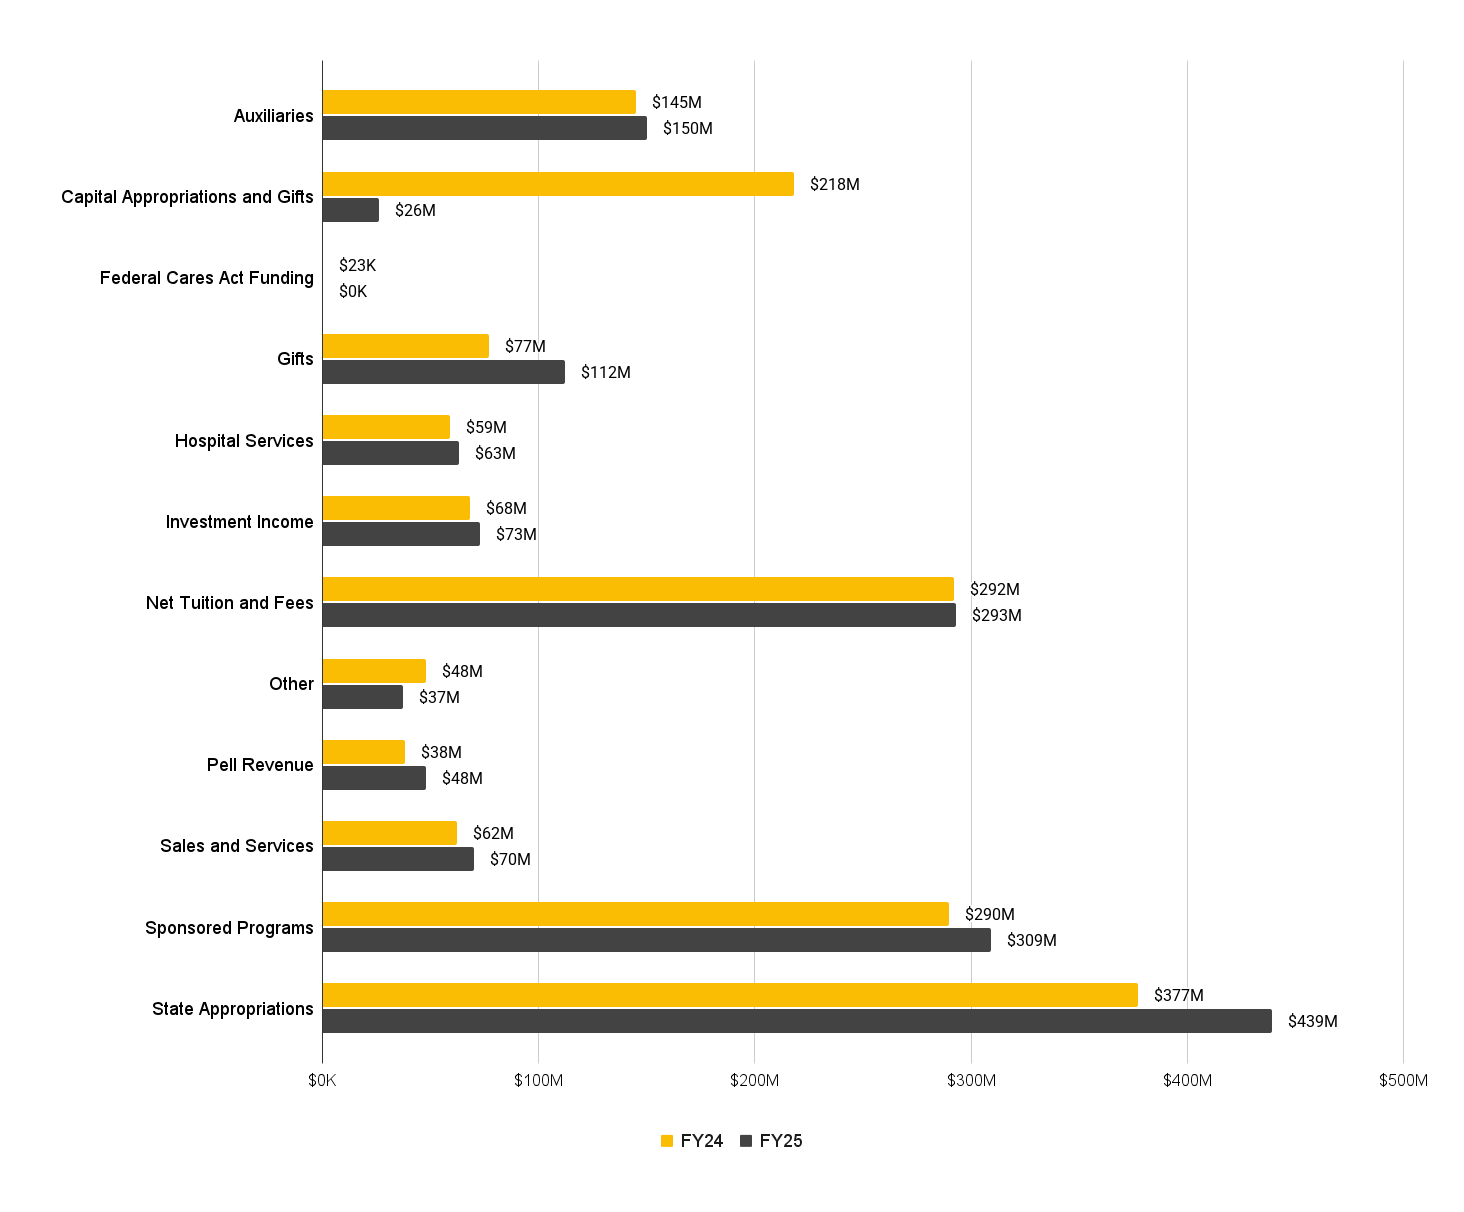
Operating revenue increases were largely in the areas of sponsored programs, as our research continues to grow as well as auxiliaries, which is a combination of fee increases and rebounding from the pandemic.
State appropriations increased for the Commonwealth's share of the salary increases, as well as additional operating support from the State.
- Federal Cares Act funding decreased since FY23 was the last year of the funding.
- Investment income had a favorable swing due to market conditions as of June 30 as well as increases in fixed income returns. Accounting standards require us to reflect the market value of our investments, which can result in unrealized gains or losses in any particular year.
| Revenues | FY24 | FY25 |
|---|---|---|
| Auxiliaries | $145M | $150M |
| Capital Appropriations and Gifts | $218M | $26M |
| Federal Cares Act Funding | $23K | $0 |
| Gifts | $77M | $112M |
| Hospital Services | $59M | $63M |
| Investment Income | $68M | $73M |
| Net Tuition and Fees | $292M | $293M |
| Other | $48M | $37M |
| Pell Revenue | $38M | $48M |
| Sales and Services | $62M | $70M |
| Sponsored Programs | $290M | $309M |
| State Appropriations | $377M | $439M |
VCU Expenses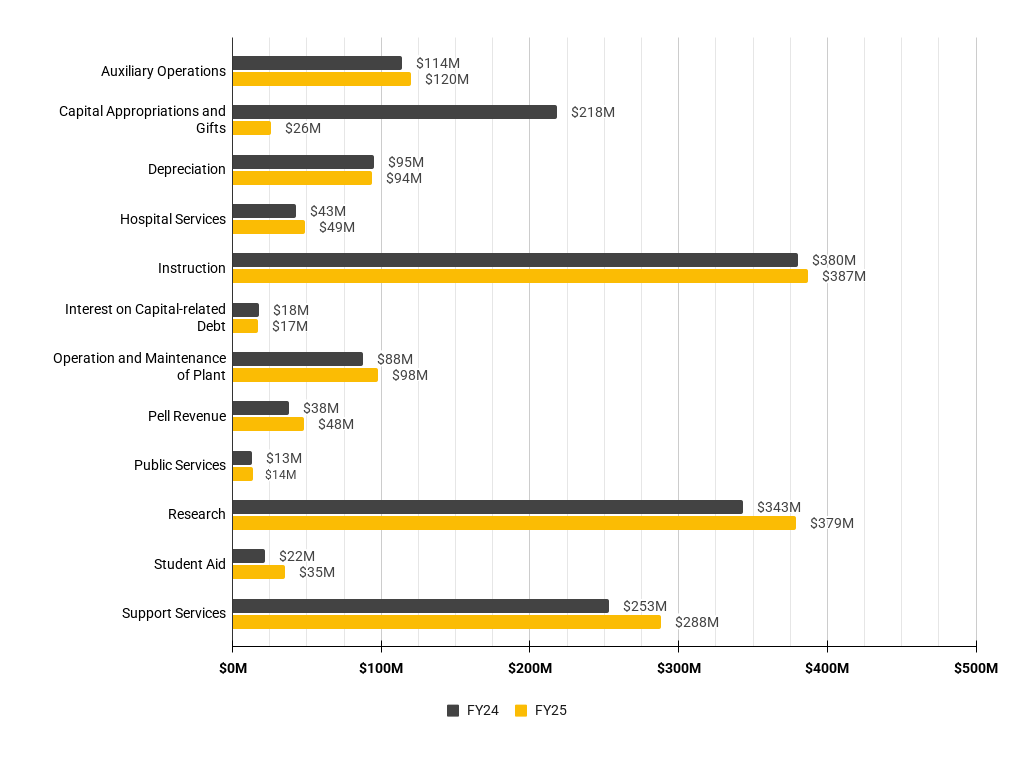
Operating expenses increased in all areas reflecting the state-mandated salary increases as well as increases in research and auxiliaries, mirroring the revenue growth. Student financial aid expenses also increased.
| Expenses | FY24 | FY25 |
|---|---|---|
| Auxiliary Operations | $114M | $120M |
| Capital Appropriations and Gifts | $218M | $26M |
| Depreciation | $95M | $94M |
| Hospital Services | $43M | $49M |
| Instruction | $380M | $387M |
| Interest on Capital-related Debt | $18M | $17M |
| Operation and Maintenance of Plant | $88M | $98M |
| Pell Revenue | $38M | $48M |
| Public Services | $13M | $14M |
| Research | $343M | $379M |
| Student Aid | $22M | $35M |
| Support Services | $253M | $288M |